In the age of data-driven marketing, simply posting on social media isn’t enough — you need to measure performance, analyze behavior, and make data-backed decisions. That’s where social media analytics comes in.
Whether you’re a business owner, digital marketer, influencer, or content creator, understanding how your content performs across social media platforms is crucial for growth, engagement, and ROI.
This guide will walk you through everything you need to know about social media analytics, including key metrics, tools, and how to use insights to boost your strategy.
✅ What is Social Media Analytics?
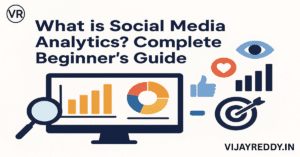
Social media analytics is the process of tracking, collecting, and analyzing data from social media platforms to understand and improve the performance of your content, audience engagement, and marketing campaigns.
It helps answer questions like:
- What type of content performs best?
- Which platform drives the most traffic or leads?
- Who is engaging with your posts — and when?
🎯 Why Social Media Analytics is Important
- 📈 Measure success of your posts, stories, ads, and campaigns
- 🎯 Understand your audience and what they like
- 🛠 Optimize content strategy with real-time feedback
- 🧠 Make data-driven decisions instead of guessing
- 💬 Improve engagement by tailoring content to audience behavior
- 💰 Maximize ROI on paid ads and organic campaigns
🧩 Key Social Media Metrics to Track
📣 Engagement Metrics
| Metric | What It Means |
|---|---|
| Likes/Reactions | Measures interest in a post |
| Comments | Shows how interactive your content is |
| Shares | Indicates content virality |
| Saves | Shows how valuable users find your content |
📊 Reach & Impressions
- Reach: Total unique users who saw your content
- Impressions: Total number of times your content was seen (can be by same person multiple times)
📥 Click-Through Metrics
- Link Clicks: Number of times someone clicked a link in your post/ad
- CTR (Click-through rate): Percentage of people who clicked after seeing the post
🎯 Conversion Metrics
- Leads Generated
- Sales/Signups
- Website Visits
- Downloads/Installs
👤 Audience Metrics
- Demographics: Age, gender, location
- Behavior: Online time, devices used
- Follower Growth: Tracks increase or decrease in followers
🌐 Platform-Specific Analytics Tools
🔹 Facebook & Instagram – Meta Insights
- Post reach, impressions, engagement
- Audience demographics
- Stories, reels, and ads performance
- Access via Meta Business Suite or Instagram Professional Dashboard
🔹 Twitter/X – Twitter Analytics
- Tweet impressions
- Engagements & engagement rate
- Top tweets, followers, profile visits
🔹 LinkedIn – LinkedIn Analytics
- Follower metrics
- Post engagement
- Company page views
- Visitor demographics
🔹 YouTube – YouTube Analytics
- Watch time
- Audience retention
- Top-performing videos
- Subscriber growth
- Traffic sources
🔹 TikTok – TikTok Pro Analytics
- Video views
- Follower insights
- Trending content
📈 How to Use Social Media Analytics to Improve Strategy
1. Identify Top-Performing Content
See what posts are getting the most reach, likes, shares, or saves — and create more of that content.
2. Understand When to Post
Use analytics to find the best time and day your audience is most active.
3. Segment by Platform
What works on Instagram might not work on LinkedIn. Use platform-specific insights to tailor your content.
4. Track Campaign Goals
Use UTMs and conversion tracking to measure the success of paid campaigns or lead magnets.
5. Monitor Competitors
Benchmark your performance and find opportunities by studying competitor engagement and trends.
🛠 Best Social Media Analytics Tools
| Tool | Use Case |
|---|---|
| Meta Business Suite | Facebook & Instagram analytics |
| Hootsuite / Buffer | Cross-platform analytics & scheduling |
| Sprout Social | Deep social insights & team collaboration |
| Google Analytics | Track social traffic to your website |
| SocialBlade | YouTube & Instagram follower stats |
| Brand24 / Mention | Monitor brand mentions and sentiment |
| Iconosquare | Instagram & Facebook visual analytics |
| HubSpot | CRM + social analytics in one dashboard |
📊 Social Media Analytics Report Sample (Monthly)
| Platform | Impressions | Engagement | Clicks | New Followers |
|---|---|---|---|---|
| 120K | 4.2K | 300 | +180 | |
| 85K | 6.1K | 500 | +320 | |
| 45K | 2.4K | 150 | +80 | |
| YouTube | 60K | 1.8K | 200 | +120 |
📋 Best Practices for Social Media Analytics
- Set clear goals (brand awareness, traffic, conversions)
- Track KPIs weekly or monthly
- Use visuals and graphs in your reports
- Tag campaigns using UTMs for proper attribution
- Combine organic + paid insights
- Review analytics with your team regularly
⚠️ Common Mistakes to Avoid
- Ignoring negative metrics (e.g., unfollows, drop-offs)
- Focusing only on vanity metrics (likes without engagement)
- Not setting measurable goals
- Not using insights to adjust content strategy
- Reporting without context or recommendations
🧠 Final Thoughts
Social media analytics isn’t just about numbers — it’s about understanding your audience and making smarter decisions.
If you’re serious about growing your brand or business online, tracking and analyzing your social media performance is a non-negotiable habit.
Use insights to refine your content, post when your audience is active, test different formats, and track what actually drives results.


